When are Seattle summer days juuust right?
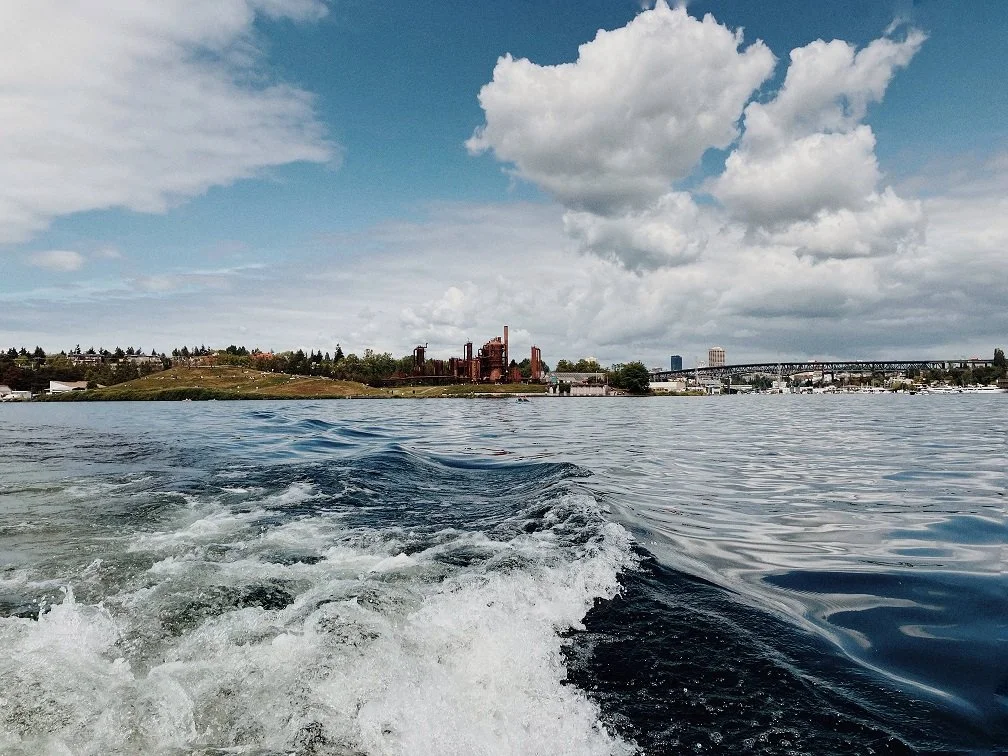
Gas Works Park from Lake Union
Seattle has a reputation for rain, but not everyone knows that Seattle summers can be glorious.
There’s a joke among locals, however, that Seattle summer doesn’t arrive until July 5. Prior to that, there’s “Juneuary,” when June weather is overcast and drizzly. “Wildfire season” is a newer phenomenon in the last ten years or so, as well.
Between extreme temperatures, rain, and smoke advisories, planning summer activities can be a moving target.
There are plenty of reasons to understand when Seattle weather is most likely to be best: Planning outdoor events, attending outdoor concerts, scheduling a camping trip a year in advance (ahem), when to tell friends and family to visit, etc - and while you can’t plan for every possible scenario, a little bit of data-driven decision making doesn’t hurt.
Which summer Seattle days are least at risk for being impacted by extreme temperatures, rain, or smoke?
This post outlines an analysis to determine how many Temperate, Not Rainy, Not Smoky Seattle Summer Days (TNRNSSSDs) there are on average in a year, and when they’re most likely to occur. The goal of these days is not that they’re “perfect” Seattle summer days, but that you can go outside without any weather concerns. (Jump ahead for results if you’re in a hurry).
Metrics and Parameters
To evaluate this, I considered the 10 year averages of three weather metrics: Precipitation, air quality, and temperature.
Precipitation
The summer months are mostly rain-free, but it shows up here and there. I was interested to know if certain times of summer were more likely to see higher quantities, or longer spells, of rain.
A TNRNSSSD has no more than 0.1” of rain. Data ranges from May 2013 - July 2023.
Air Quality
Air quality becomes a consideration in the summer because of the lack of rain, lingering traffic smog, and smoke from wildfires.
While there are many metrics to measure air quality, I used PM2.5 due to historic data availability, and because of its use as a standard component of overall air quality. “PM” stands for Particulate Measure, and the value “2.5” indicates the size of the particulate matter. Per the EPA, PM2.5 “describes fine inhalable particles, with diameters that are generally 2.5 micrometers and smaller.”
I established parameters following WHO guidelines for “Good” levels of PM2.5 for this analysis, which was 12.0 μg/m³ or less. Data ranges from May 2015 - July 2023 (eight years of available data).
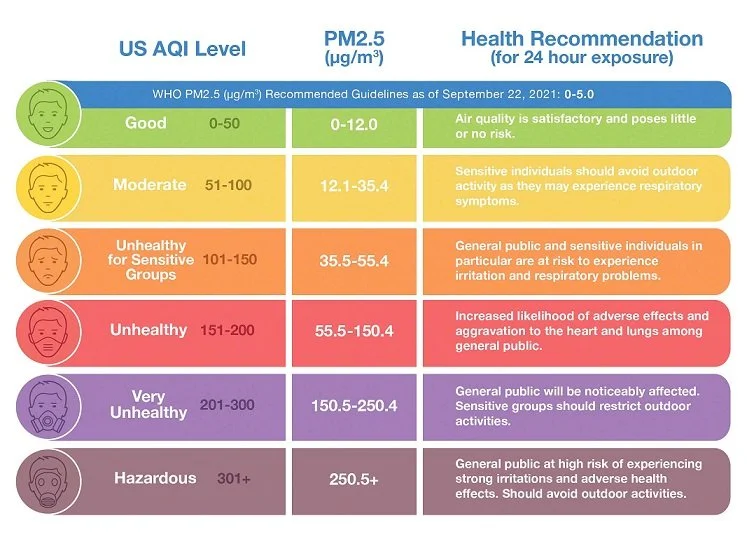
Air quality rankings based on levels of PM2.5. A range of 0-12.0 PM2.5 is considered "Good" air quality. Image from IQAir.com.
Temperature
While Seattle summers are mostly warm and temperate, we do occasionally get cooler, wetter summers, and heat waves.
The ideal max temperature range for a TNRNSSSD is between 70 - 90 degrees Fahrenheit. Data ranges from May 2013 - July 2023.
Summer Months Range
Typically, I’d consider a Seattle summer to begin on Memorial Day in late May, and end on Labor Day in early September. But for this analysis, I included the entire months of May and September as shoulder seasons and to draw more accurate conclusions about those months as a whole.
Findings
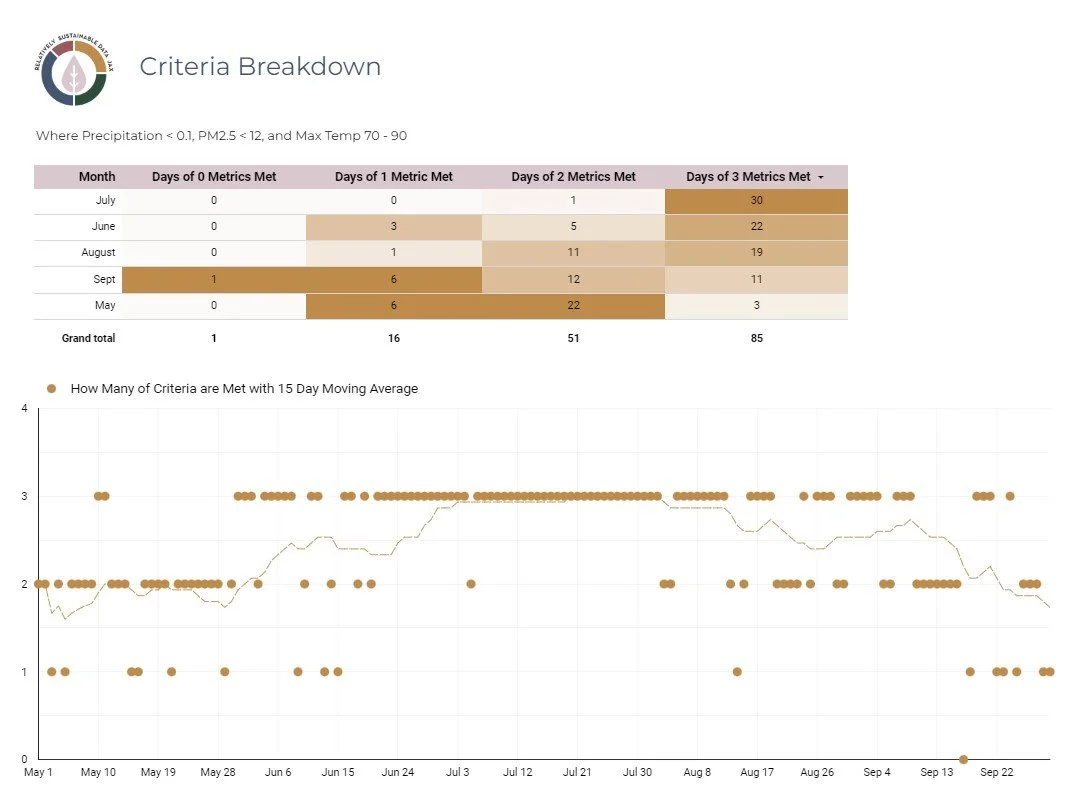
July has the highest likelihood of Temperate, Not Rainy, Not Smoky Seattle Summer Days (TNRNSSSDs).
Of 153 summer days, 56%, or 85 summer days, met all three criteria for ideal precipitation, air quality, and temperature.
The months with the highest likelihood of TNRNSSSDs are:
July, with 97% likelihood
June, with a 73% likelihood
August, with a 62% likelihood
September, with a 37% likelihood
May, with a 10% likelihood
It’s not gonna be May
May had the fewest TNRNSSSDs, with around 10% of days meeting all three weather criteria.
But May had 22/31 days, or 80%, that met two out of three criteria, which was the highest percentage for two criteria for all months. What’s keeping May from all of these TNRNSSSDs?
Temperature appears to be the culprit:
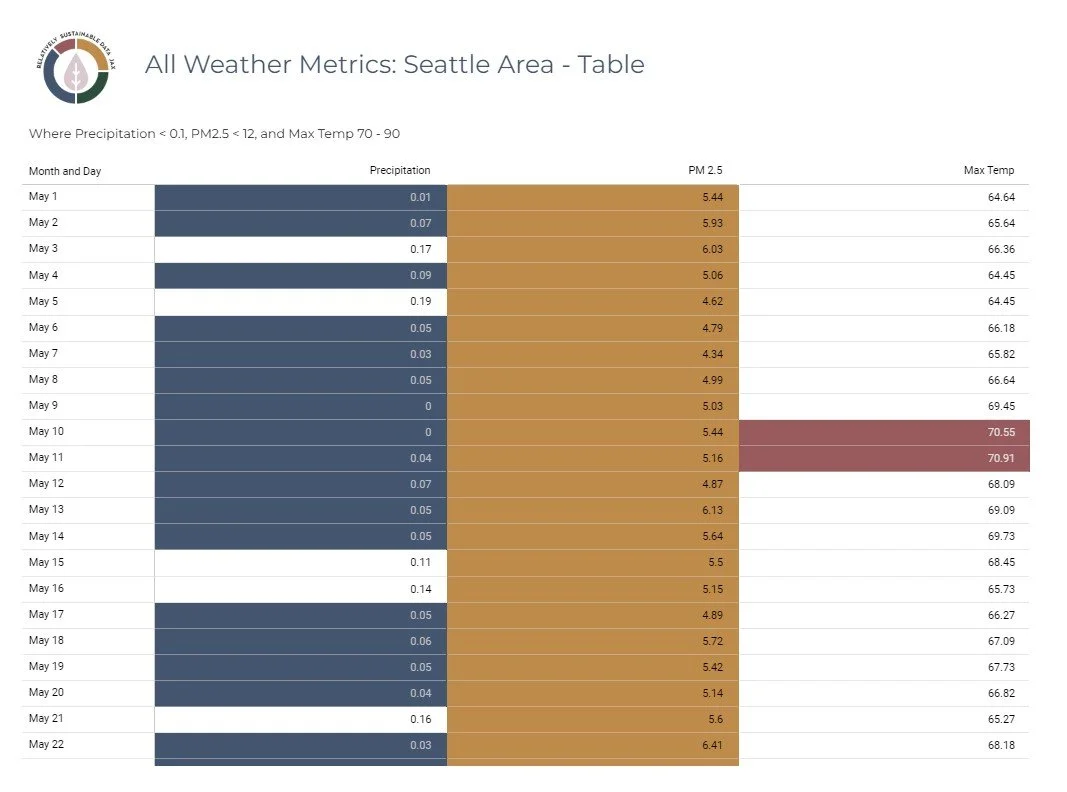
However, closer to Memorial Day weekend at the end of May, temperatures are closer to meeting the 70 degree parameter.
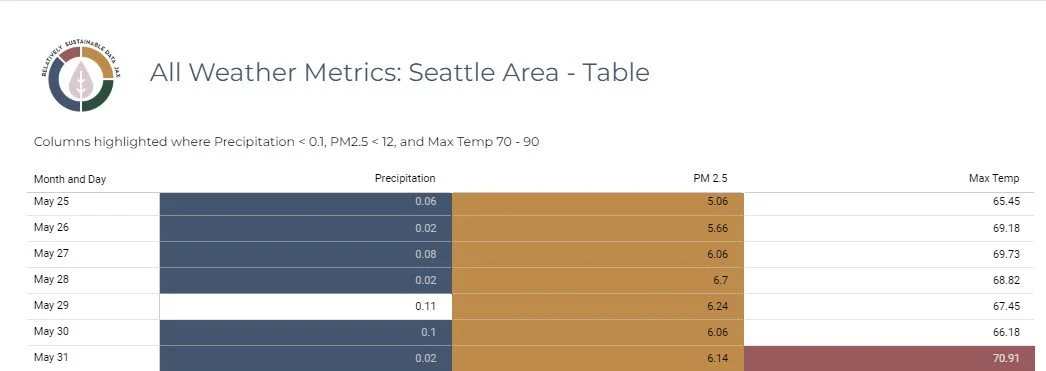
Is Juneuary fact or fiction?
June has the second highest number of TNRNSSSDs, with 22/30 days meeting all of the criteria.
Rain-wise, June has an average of 22 days with 0.02 precipitation or more. By comparison, July has only 10 average days of 0.02 precipitation or more. Even without high precipitation days, my suspicion is that persistent cloud cover is a contributing factor in “Juneuary.”
In terms of temperature, the June average is 72 degrees, and the July average temperature is 78 degrees.
If Juneuary is based on cloud cover and some precipitation, it’s fact. If it’s based on temperature, it’s closer to fiction.
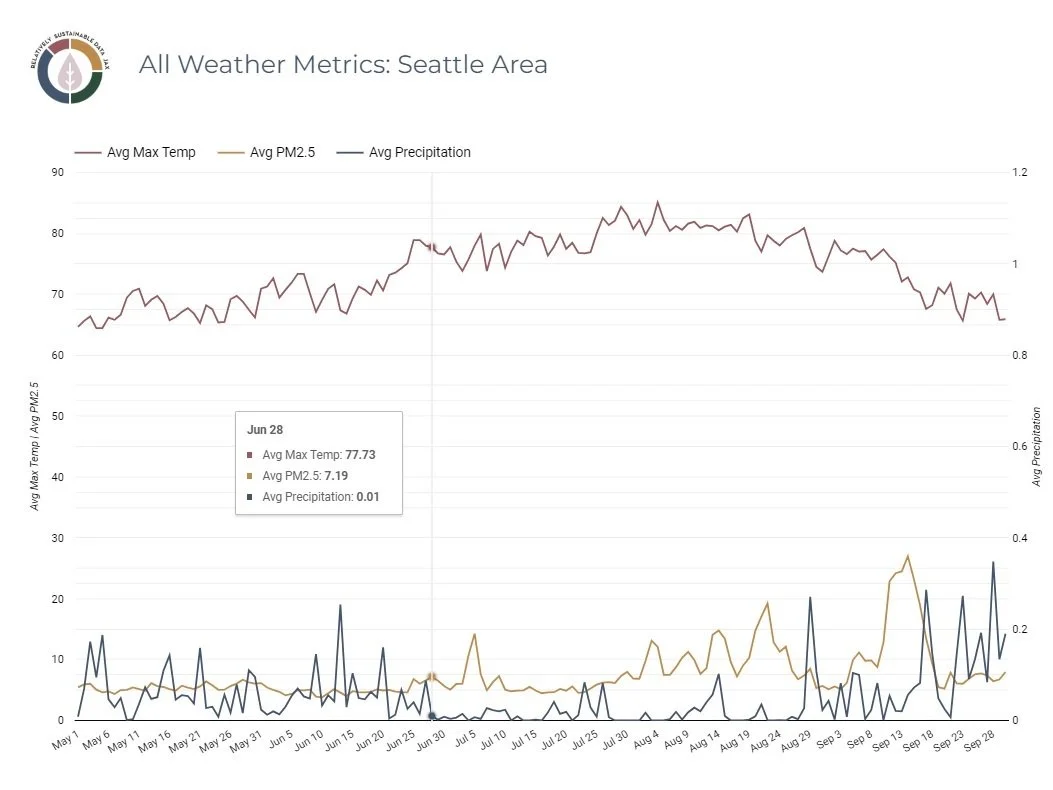
June 28 is when the weather turns and begins to look a lot more like July. There is a noticeable spike in temperature around that time, in addition to a drop in precipitation. This change sets the scene for continued low precipitation through mid-August, and rising temperatures through early August.
What’s going on with July 5?
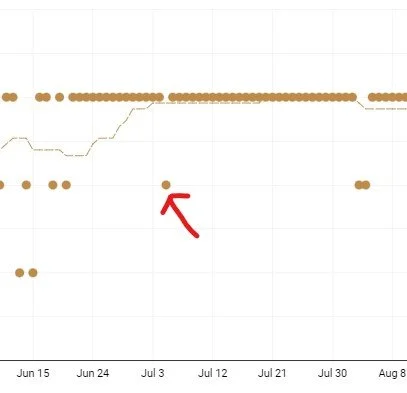
July 5 is an outlier in an otherwise 43-day stretch of TNRNSSSDs
You might have noticed that in the streak of June 21 - August 2, every single day meets all three criteria for a TNRNSSSD, EXCEPT July 5, which is more likely than other days to fail the air quality test. My best guess is that the day before has something to do with it:
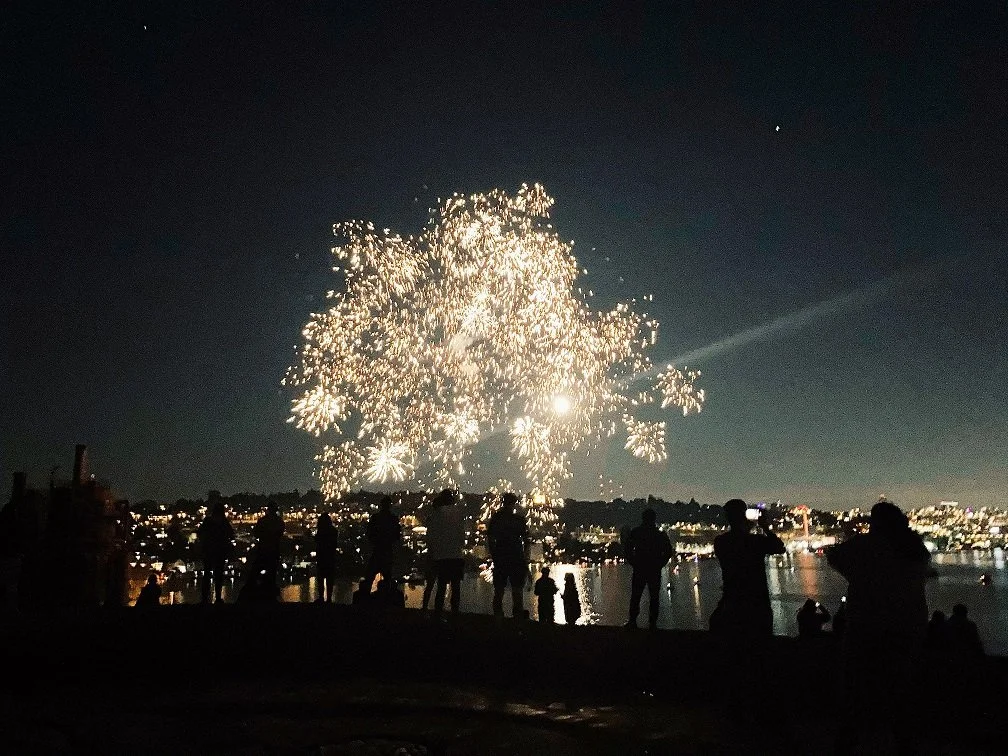
Fireworks visible from Gas Works Park on July 4. Bad for air quality, but pretty.
Other than that, July is the TNRNSSSD darling with 30/31 days that meet all three criteria.
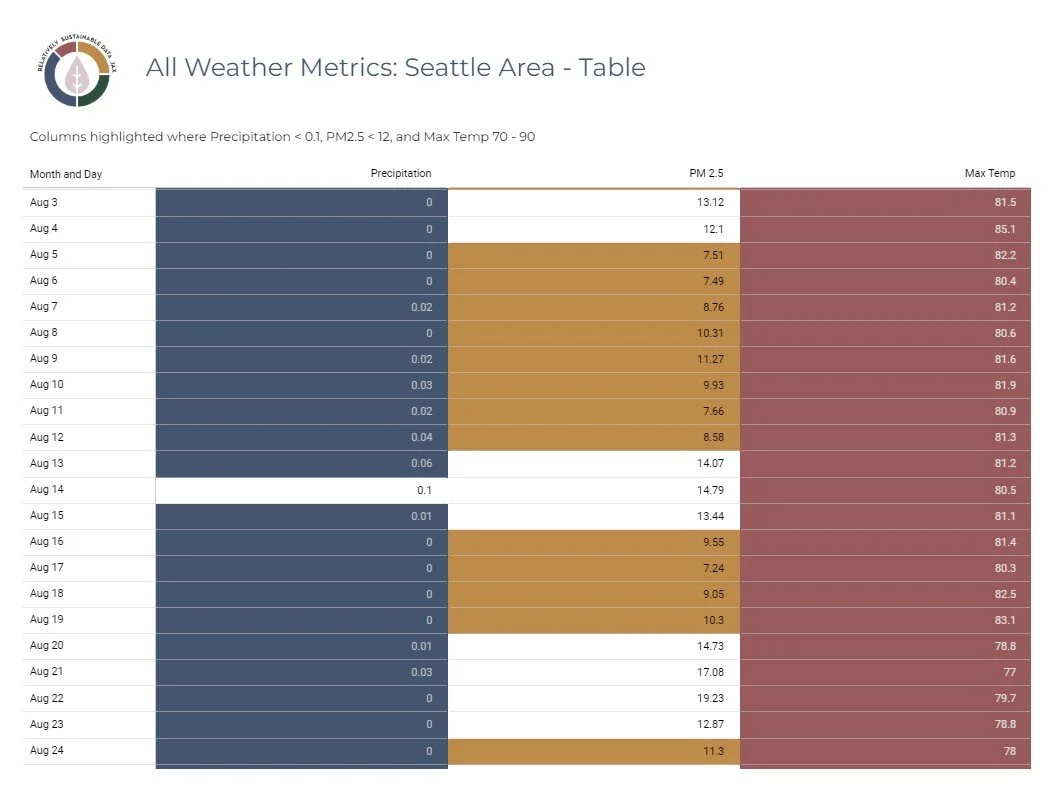
August: Wildfire szn begins
August comes in at #3 of TNRNSSSD likelihood with 19/31 days meeting all three criteria. August mostly loses out on meeting air quality standards.
Wildfires are not a new phenomenon of course, but are a relatively new recurring phenomenon in and around Washington State, enough that it impacts air quality. In August of 2015, then-President Barack Obama declared state of emergency in Washington due to wildfires that burned 1,562 square miles. The second worst fire season in Washington State was 2020, with 1,316 square miles burned, and third worst was 2021, with 781 square miles burned. Put another way, three of the state’s worst wildfire seasons occurred in the last eight years.
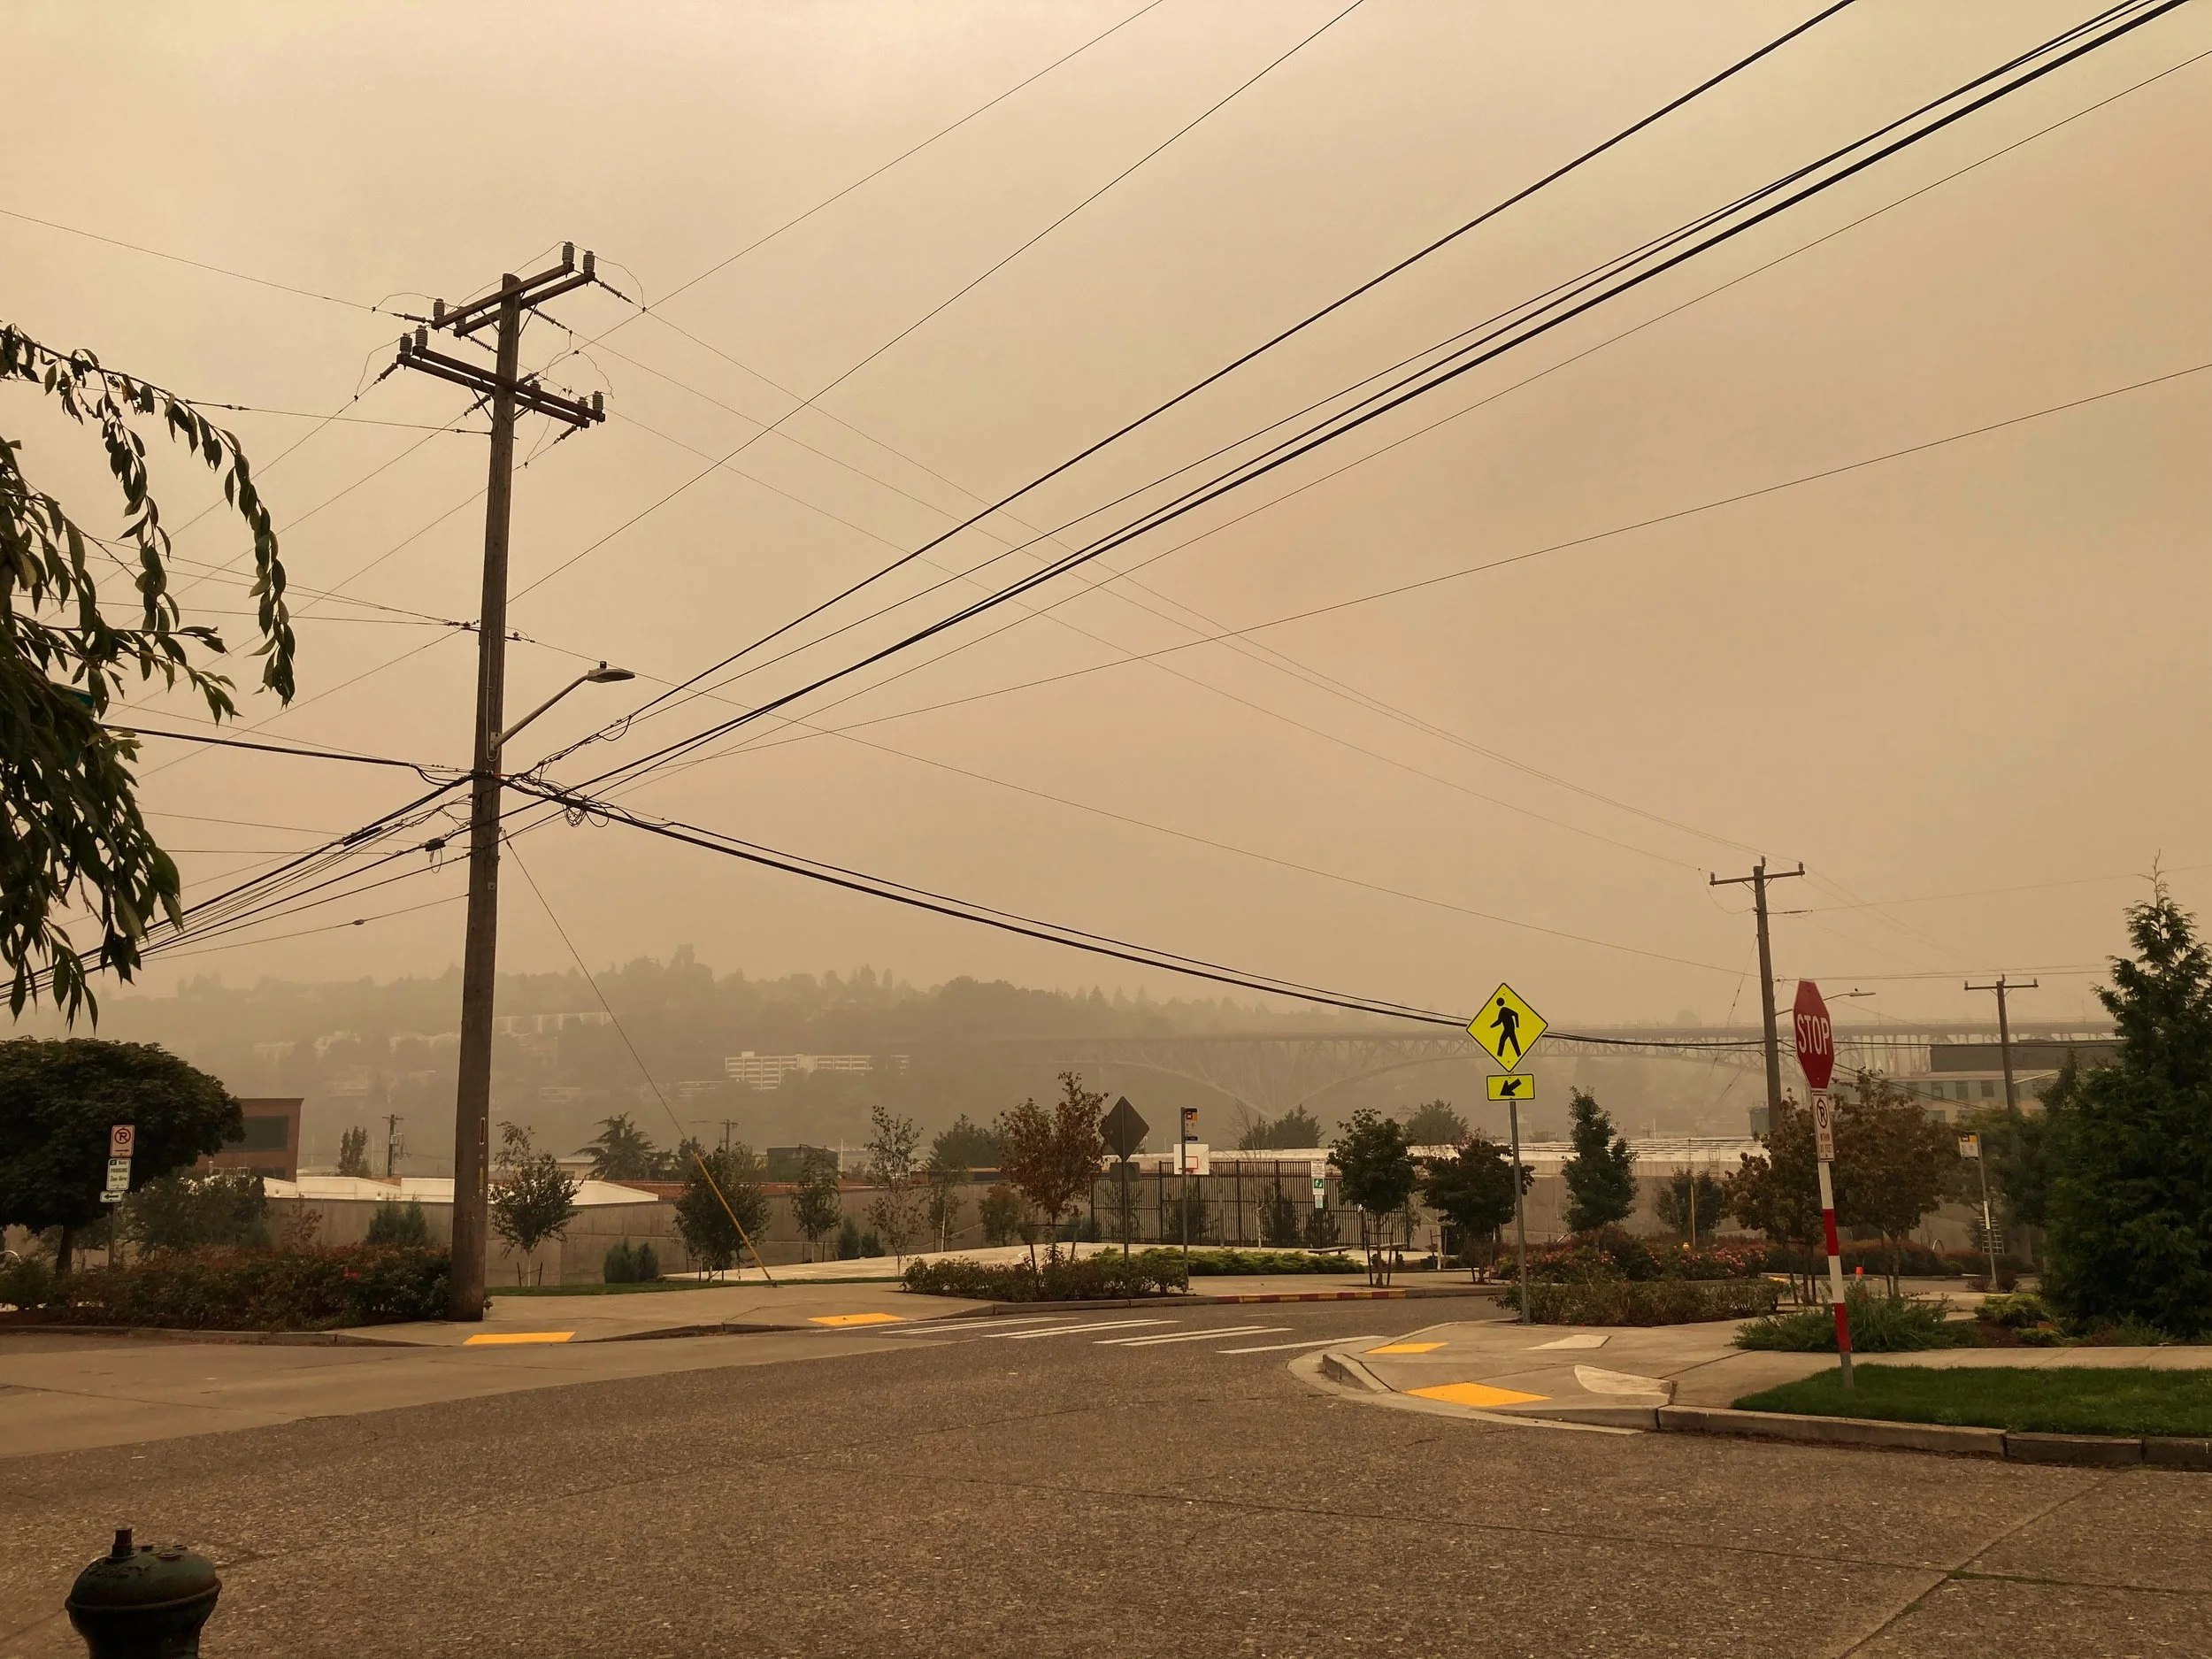

Left: Wildfire smoke in Wallingford neighborhood looking towards Aurora Bridge, Sept 2020
Right: Smoke plume from a wildfire near Lake Chelan, August 2021
Those three wildfire years skew the averages of eight years of air quality data, of course. As a result, August on the whole shows an upward trend in poor air quality. PM2.5 in August nearly doubles compared to the three prior months.
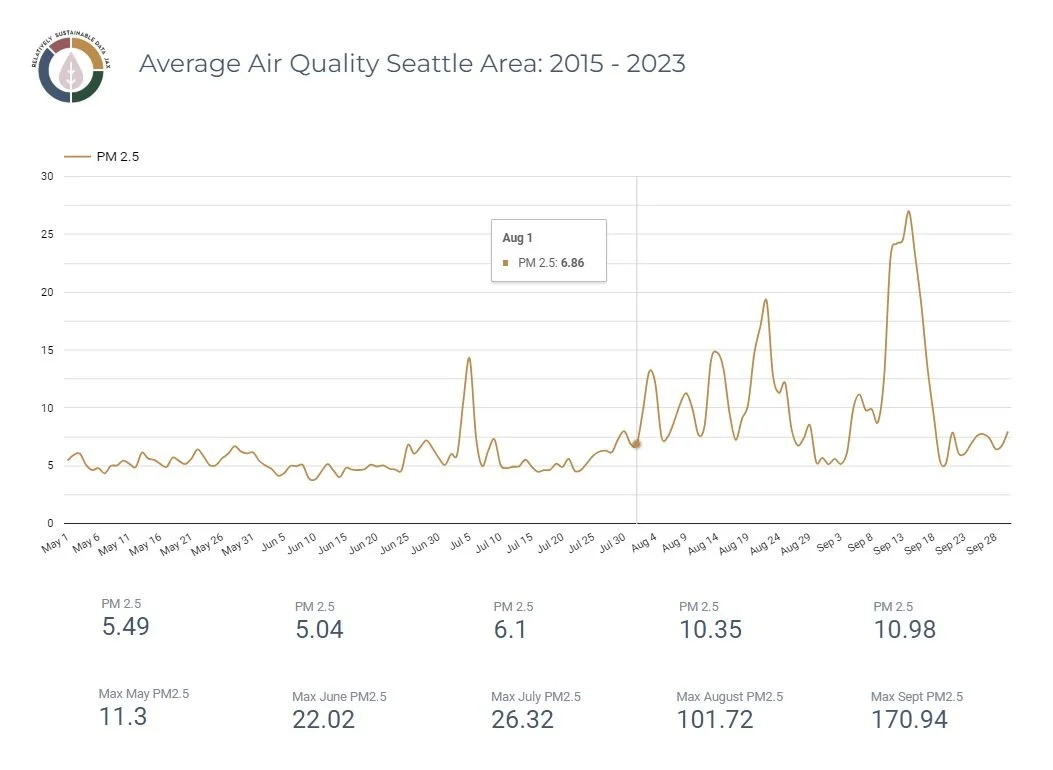
High levels of PM2.5 don’t only come from wildfires to be sure, and can come from a “variety of sources.”
September is WAP (Wet And Precipitatious)
No spot on the podium for fourth place September, with 11/30 TNRNSSSDs.
September has the most variation in all three categories. Temperatures are still warm and temperate, but ramp down toward the end of the month. Scroll through the specifics.
More interesting is how rain impacts PM2.5 levels. We don’t see this trend in August because August is the second driest month, following July. September, however, is WAP compared to the prior four months.
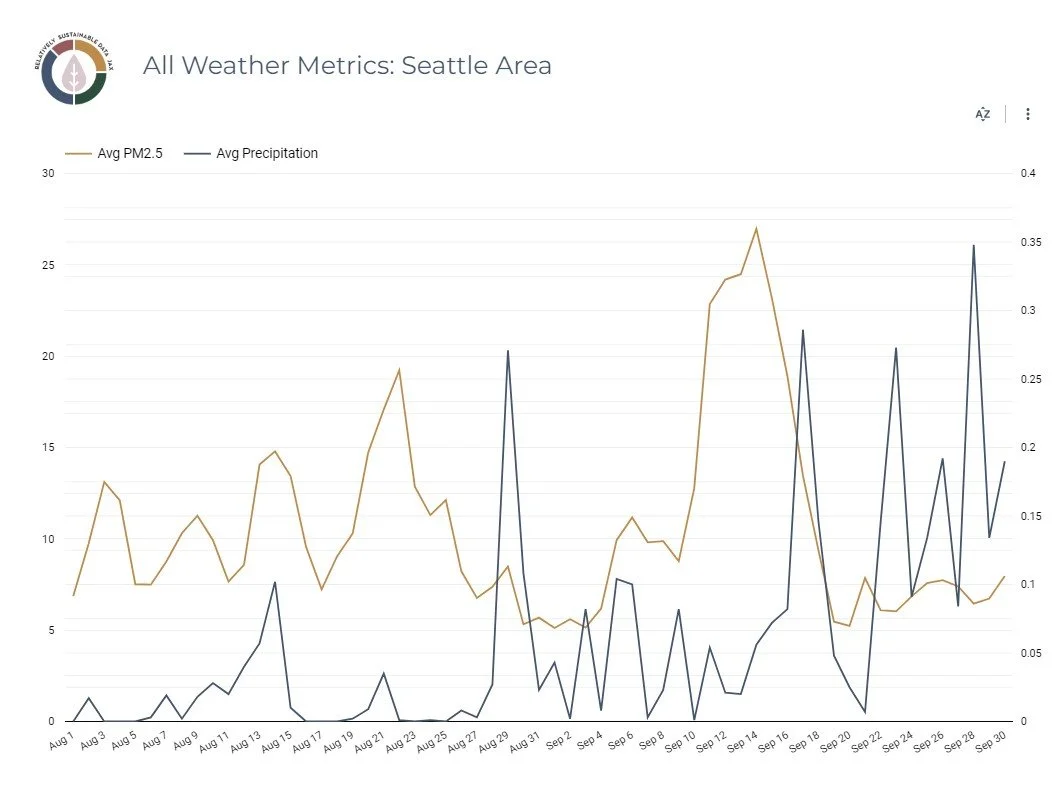
Established above, some of this poor air quality is skewed from a few years of very bad wildfires. Sept 11ish-14ish, 2020 in Seattle area was particularly awful.
TL;DR
Best months to experience a Temperate, Not Rainy, Not Smoky Seattle Summer Day:
July with highest likelihood, June with second highest likelihood
Best months to avoid rain:
July and August
Best months for air quality:
May - July
Best months for warm weather:
July and August
Overall winner for Seattle summer weather:
July
Data Notes:
Precipitation
All precipitation data is from NOAA for “Greater Seattle Area.” Between the months of May - September, from 2013 - 2023. Occasional “T” data points, which indicates trace amounts of rain, but not enough to quantify, were changed to “0” for this analysis.
Air Quality
All air quality data is from PSCleanAir.org using an average of the the “King County” group of stations. Data goes back as far as 2015.
Other data challenges and considerations
This analysis was based on averages, which was useful when metrics fell within a reasonable range each year, but was less useful, and skewed data, during years where there were extreme weather events that aren’t representative of typical weather patterns.
It could be argued that extreme weather events are increasing globally, and therefore should be included as part of the averages, rather than anomalies. In this analysis, I kept them in.
However, I do think that higher-level monthly results are more useful than daily results.
Looking at the two major outliers: July 5 is a good example of air quality falling into a reasonable range every year. Between 2015 - 2023, PM2.5 is between 8.33 and 24.9.
Sept 17 is a good example of a single day skewing all of the data, where a typical PM2.5 range is 3.2 - 11.42, except for 2020 where PM2.5 was 68.89.

While averages are useful, they need to be contextualized correctly.
It’s
Gonna
Be